I had a narrative in mind when I started researching this piece. Having been away last weekend, I only caught bits and pieces of the Mid Season Invitational, and my main source of MSI information was the reddit recaps. Looking at the statistics, the thing that stood out to me throughout the tournament, day 1 through finals, was how incredibly sloppy the games were. Games averaged nearly a kill per minute, with the winning teams averaging a whopping 14 more kills than their opponents. The game lengths tell the same story; only three games in the entire tournament lasted 40 minutes, of which only one playoff game lasted that long. Even with the close playoff series between SKT and Fnatic, then between SKT and EDG, most individual games in those series were stomps — none of those games lasted into the 39th minute. Then there’s the story of the dragons. This is the story I went looking for through the MSI statistics, and the results are fascinating, if inconclusive. For much of the tournament, teams seemed to congregate around dragon and fight to the death, leaving subtlety and caution to the wind. The result is a tournament full of kills and dragons, with none of the finesse we have come to expect from the highest level of teams.
Yet overall, it is difficult to draw conclusions from the numbers I gathered. For one thing, the samples are incredibly small. One or two outlier games can ruin the analytic value of the data. More importantly, though, is that the data itself is inconclusive. On day 1, teams went for dragons at a much lower rate than they did in their regional playoffs — is that because the teams won so easily that they did not need to fight at dragons, or simply because they were risk-averse on the first day against new opponents? On the second day, dragons were killed at an incredibly high rate — were teams acing their opponents and taking a quick dragon, or did they just take advantage of unprepared enemies to sneak it quickly? At first I planned to take the data I gathered and try to tell the story of the tournament as I saw it, but it is clear to me that doing that would be disingenuous. There are simply too many possible explanations and variables to account for. Instead, I will present the data as I found it, and apart from a bit of editorializing, leave it to the reader to decide what it means.
Day 1: Off to a slow start
Average Game Time: 32:23
Average Number of Kills: 29.2
Average Number of Dragons: 3.43
Average Time Dragon is Alive: 2:43
Day 2: Fast and Loose
Average Game Time: 31:30
Average Number of Kills: 34.7
Average Number of Dragons: 3.86
Average Time Dragon is Alive: 1:31
Day 3: The Spirited Semis
Average Game Time: 35:36
Average Number of Kills: 33.5
Average Number of Dragons: 4.38
Average Time Dragon is Alive: 1:34
Day 4: Fighting in the Finals
Average Game Time: 35:33
Average Number of Kills: 34
Average Number of Dragons: 4
Average Time Dragon is Alive: 2:16
The first day involved fewer kills and fewer dragons than any other days, suggesting a tentativeness to open the tournament. Then in the middle of the tournament, teams were getting kills at incredible rates, and fighting for dragon almost instantly. Finally, as the dust settled in the finals, the kills stayed high but the dragons went back to a more reasonable rate of capture. The evolution of the tournament is interesting, since most of these teams won their regional playoffs based on a much less bloodthirsty style. Disciplined objective-based teams were abandoning the slower style to fight repeatedly at dragon. For reference:
SKT in LCK Playoffs
Average Game Time: 40:26
Average Number of Kills: 27.3
Average Number of Dragons: 4.88
Average Time Dragon is Alive: 1:47
More than any other team, SKT was willing to slow the game down and play for objectives. Even in much longer games, SKT’s LCK playoff games averaged fewer kills than the MSI games to go along with an elevated dragon rate. Where was that opportunistic, objective-based team in the finals?
EDG in LPL Playoffs
Average Game Time: 32:48
Average Number of Kills: 24.8
Average Number of Dragons: 3.85
Average Time Dragon is Alive: 2:07
Despite their kill-happy reputation, EDG averaged quite a low rate of kills in the LPL playoffs. Perhaps the EDG reputation stems more from their insanely fast games; before the MSI, EDG had not played a 40 minute game since the last week of the LPL regular season.
FNC in EULCS Playoffs
Average Game Time: 33:51
Average Number of Kills: 26.9
Average Number of Dragons: 3.9
Average Time Dragon is Alive: 2:19
Again, a famously bloodthirsty team with significantly lower rates of kills and dragons than most of the MSI.
Ahq in LMS Playoffs
Average Game Time: 40:56
Average Number of Kills: 36.9
Average Number of Dragons: 5.2
Average Time Dragon is Alive: 1:23
Finally a team that starts to reach MSI rates of kills and dragons. The glaring difference is that ahq averaged nearly 41 minutes per game in ten LMS playoff games. Quick dragons become more relevant as the game goes longer since the threat of fifth dragon is stronger. Ahq’s regional performance indicates a team that is going for a fifth dragon over a team that simply groups to fight at dragon.
The MSI featured a style of play that was nothing like the style any of the involved teams had played before. Contrary to the controlled, disciplined style that got these teams to the tournament, they played hectically and dangerously. There are any number of explanations for this — teams had jetlag, they were showing off for the fans, lack of time for preparation, unfamiliar opponents — but the end result was a bit of a mess. It is not to say the MSI was not entertaining, but it was definitely not good League of Legends.
Appendix I: Scatterplots
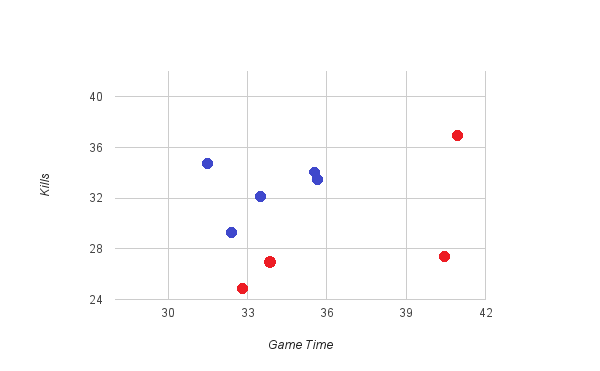
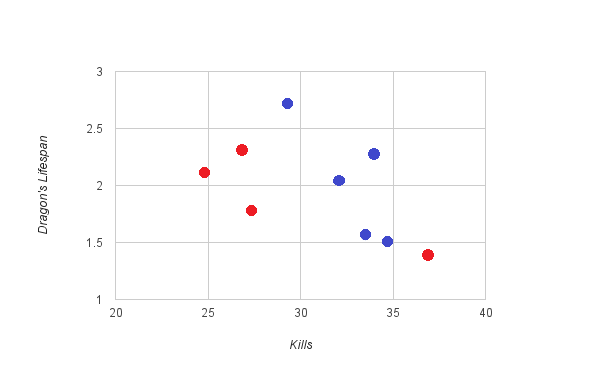
Tough to get a read on what the data means, but I thought I would be remiss in not giving some picture of the numbers I wrote out so meticulously above. For the following scatterplots, red is regional playoff performance, and blue is the different days of the MSI, plus the MSI average.
Appendix II: My data
I do not pretend to have all the answers of what my data means, so I thought I would make it available to whomever wants it. It includes not only the data above, but also more granular statistics about kills and dragons taken in specific games. Of particular interest to me was how frequently the losing team at the MSI had 0 dragons, suggesting a heavily snowballing game. As a contrast, there was only one game in the entire data set in which the winning team had 0 dragons.

